LOADING
Skip to content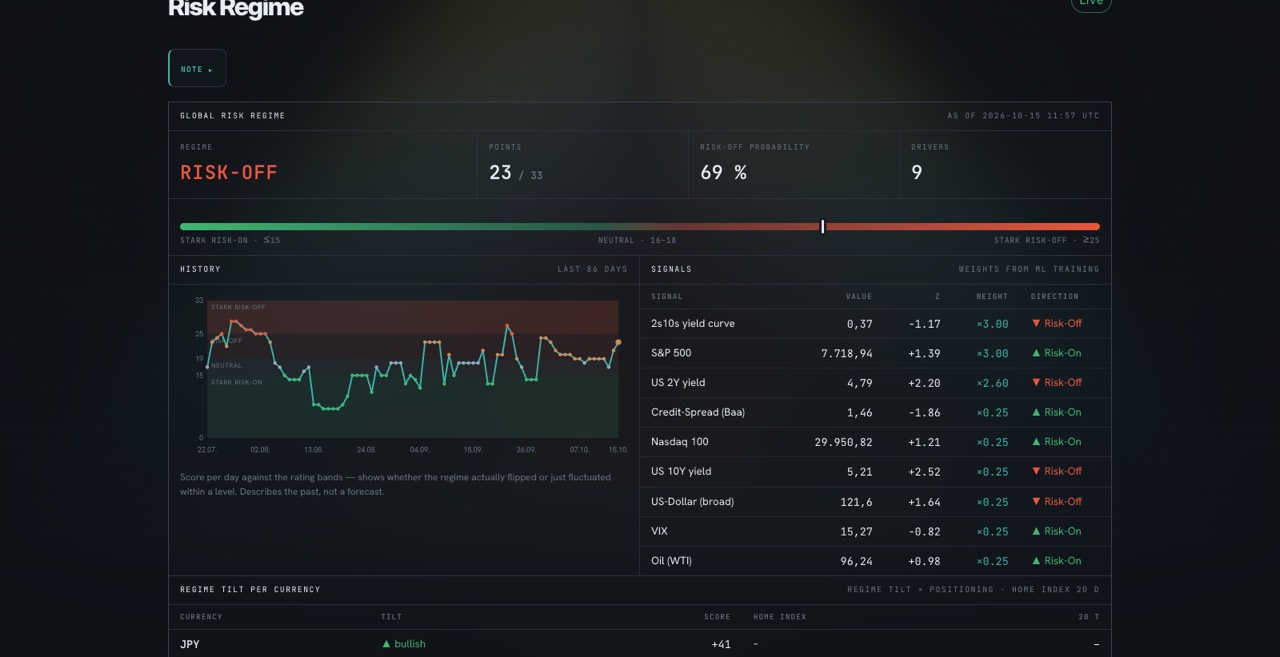
Features
Every side of the fundamental picture
Regime, rates, positioning, valuation, seasonality, models and your own strategies — in one terminal, computed and ready every morning.
Views18
Indicators470
Data sources15
Currencies8
Pairs28
What the terminal tracks
The majors are the core — the rest provides the context.
Currencies8USD, EUR, GBP, JPY, CHF, CAD, AUD, NZD
Pairs28every cross of the eight, daily data since 2013
Other markets4Indices, commodities, yields, crypto
Central banks8Fed, ECB, BoE, BoJ, SNB, BoC, RBA, RBNZ
01 · Risk regime
Risk-on or risk-off — as a score, not a gut feeling.
The regime combines nine drivers — among them VIX, credit spreads, the yield curve, equity indices, bond yields, oil and the dollar — into a score from 0 to 33 and shows which input is pulling right now. With history, so you see whether the mood is turning or just twitching.
Read the background in research02 · Central banks, rates & carry
What the rate differential pays today — and what the market prices for tomorrow.
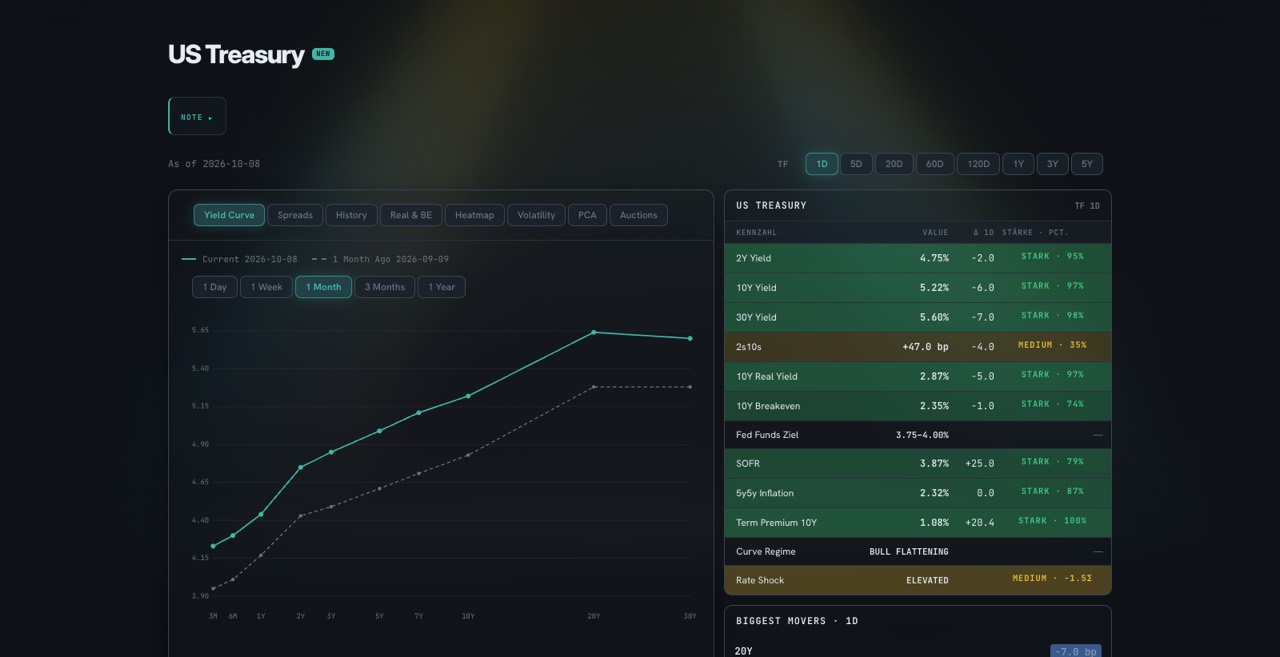
The interest rate & carry monitor puts policy rates, government bonds and the expectations derived from them side by side per pair, with a theoretical forward and a swap calculator. Central bank intelligence puts each central bank in context, US Treasury shows the curve, spreads and auctions. The macro surprise tracker records the consensus per release and sets the actual value against it.
Read the background in research03 · Macro valuation
Where a rate should stand on fundamentals — kept apart from the forecast.
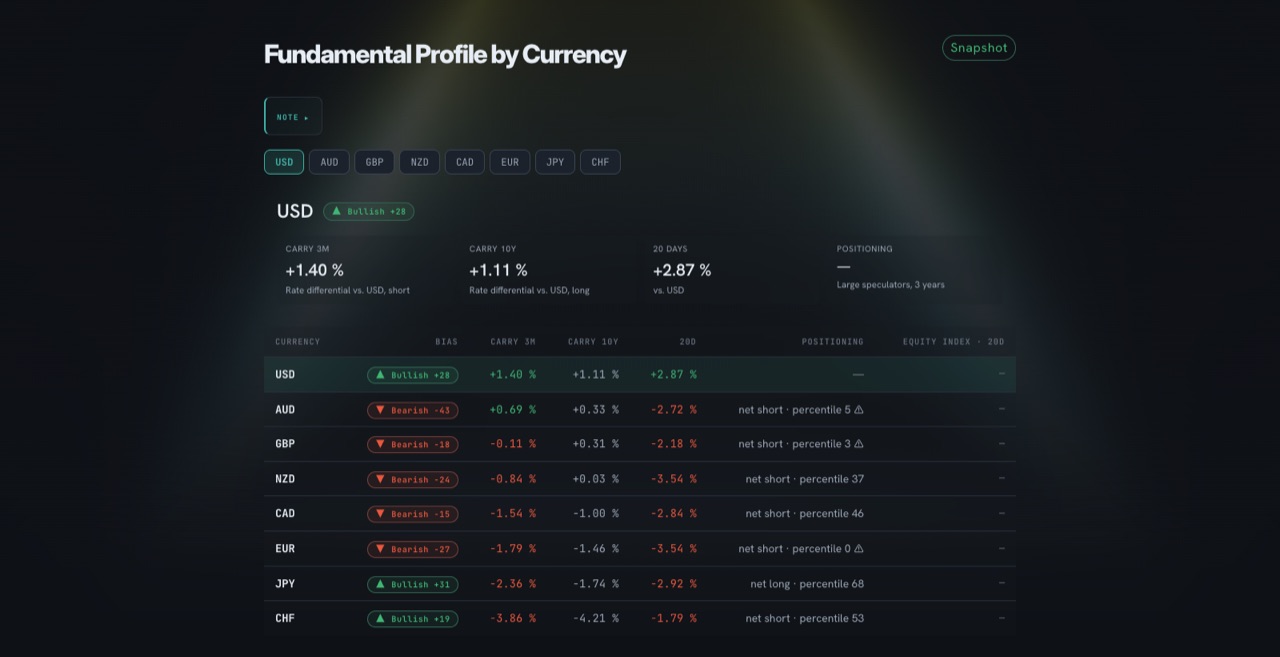
Macro fair value estimates an equilibrium rate per pair from price levels and fundamentals, with a forecast of the equilibrium itself and an open backtest. The macro divergence radar flags when a rate drifts away from what rate differentials and positioning have explained so far. The fundamental profile shows each currency on one page.
Read the background in research04 · Positioning & strength
Who is positioned how — and how extreme is it?
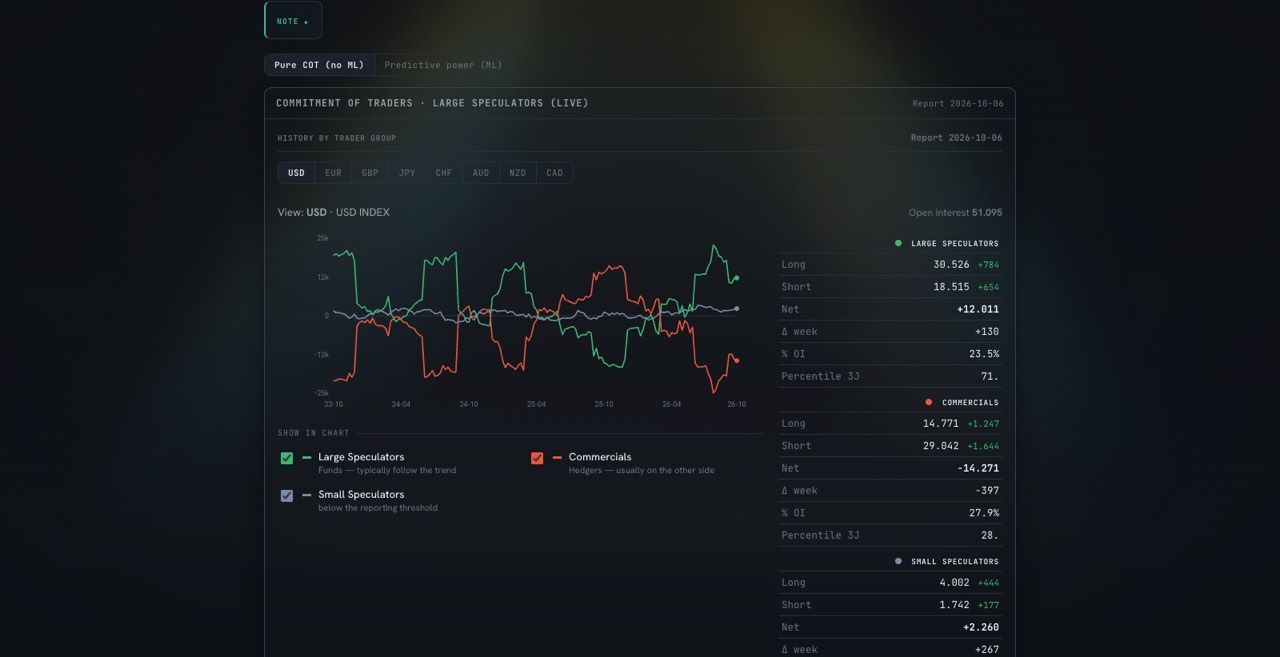
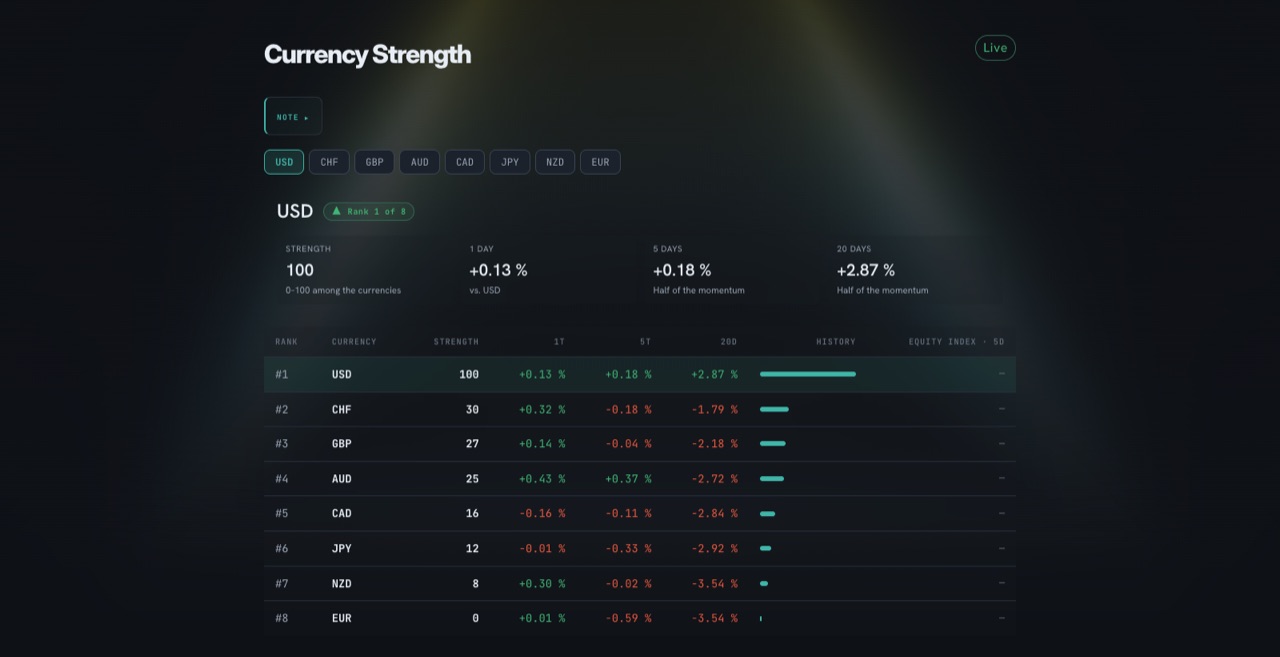
The COT index shows the net positioning of every trader group as a value from 0 to 100 against its own history — over 26, 52, 104 or 156 weeks, from the legacy or the financial-futures report. Currency strength ranks all eight currencies by momentum, sector performance puts sectors and currencies side by side.
Read the background in research05 · Correlation, volatility & regression
What moves together, what against each other — and when does it break out?
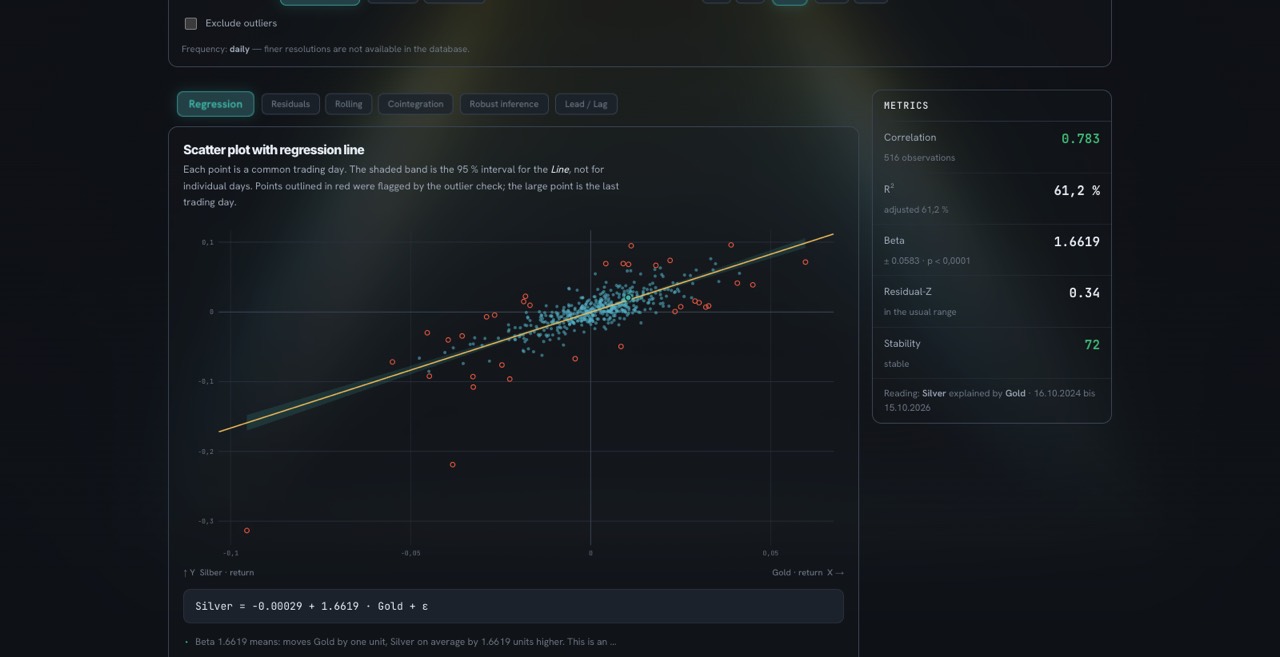
The correlation matrix shows relationships, historical and option-implied, across currencies, commodities and yields. Volatility keeps realised, implied and forecast volatility deliberately apart. Regression & relative value measures how far a market strays from its partner.
Read the background in research06 · Seasonality
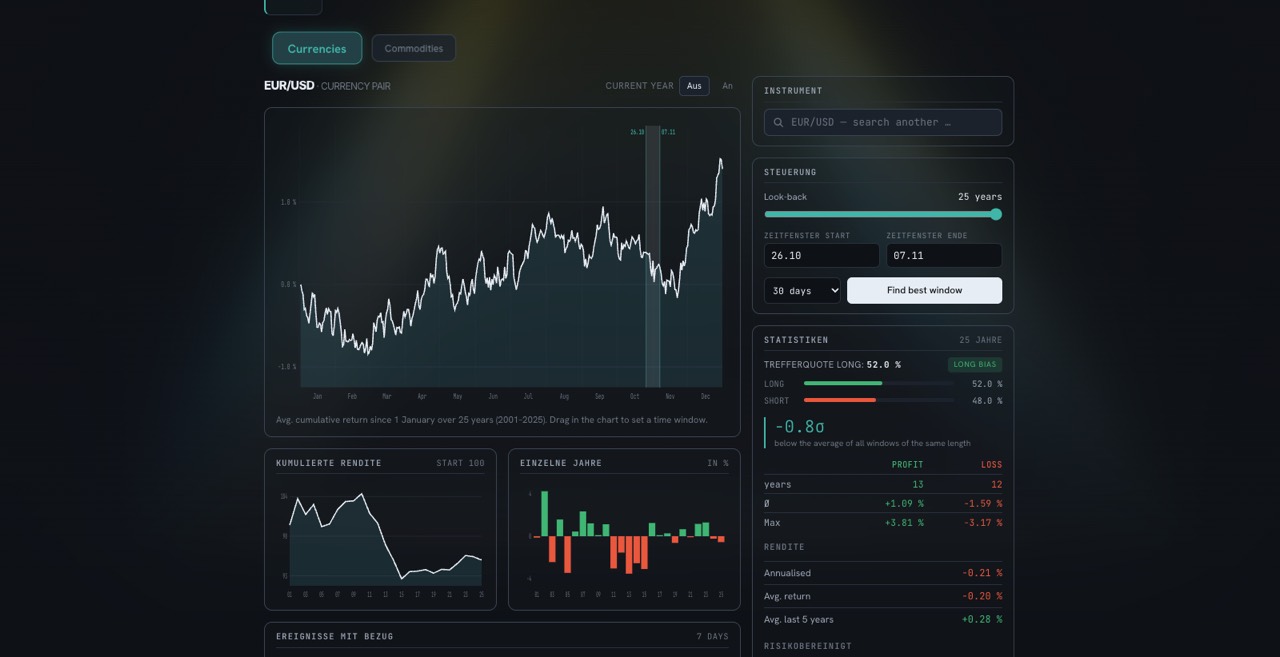
How a pair behaved in the same weeks of earlier years.
Up to 32 years of history, free range, weekdays and statistics for every pattern — hit rate, spread, average move.
Read the background in research07 · World & news
Events where they happen.
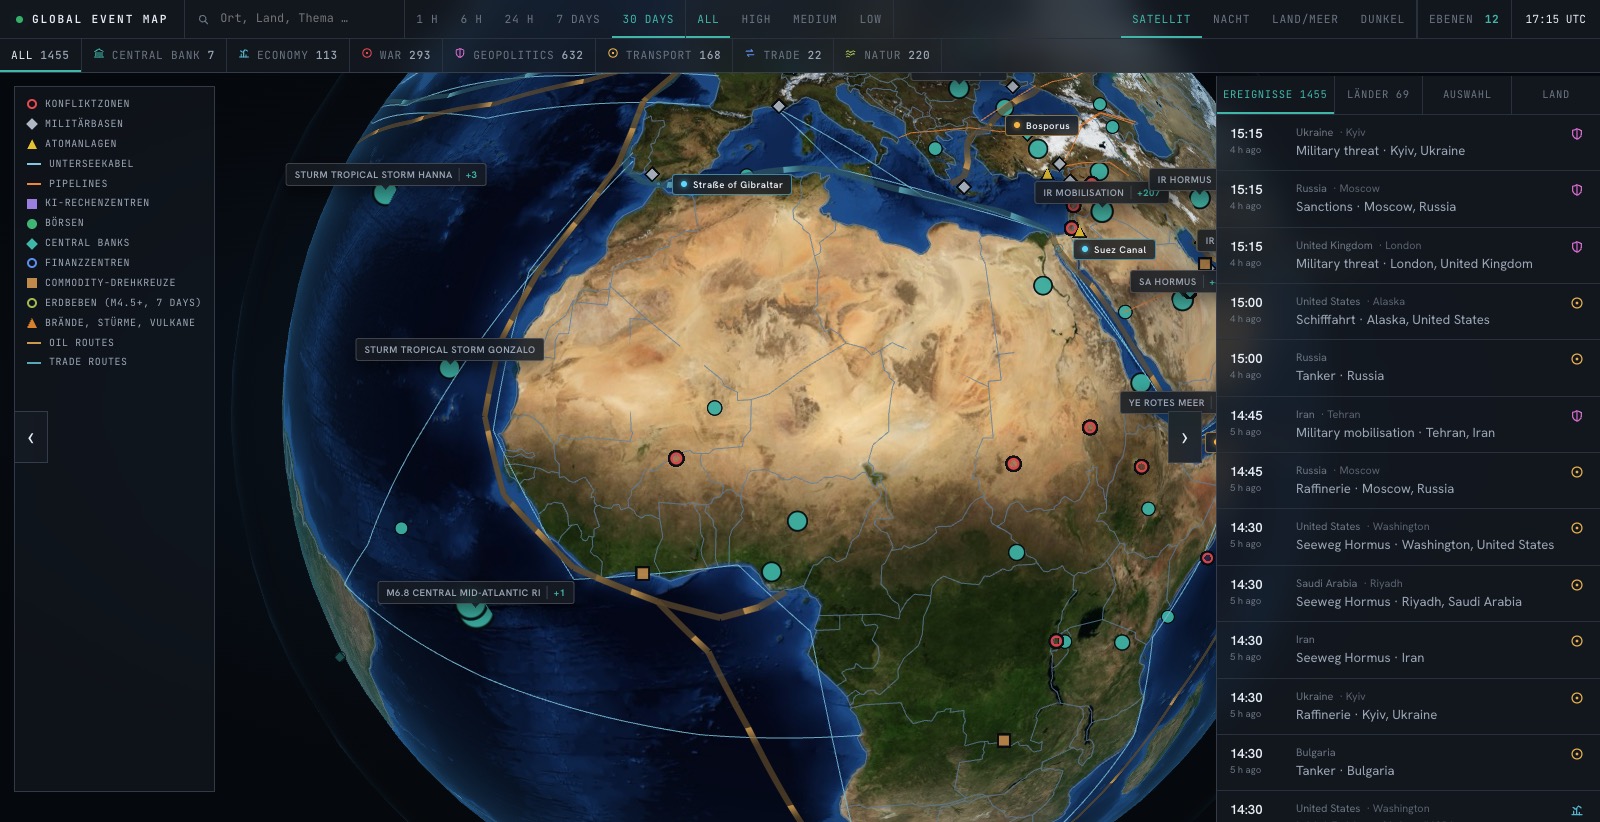
The global event map is a full-screen globe with satellite imagery, layers and the values per country; the country score condenses the economic condition of each country into a score from 0 to 100. News & sentiment collects headlines and the calendar per currency.
Read the background in research08 · Models with an open test record
A direction as a probability — and every miss stays on the record.
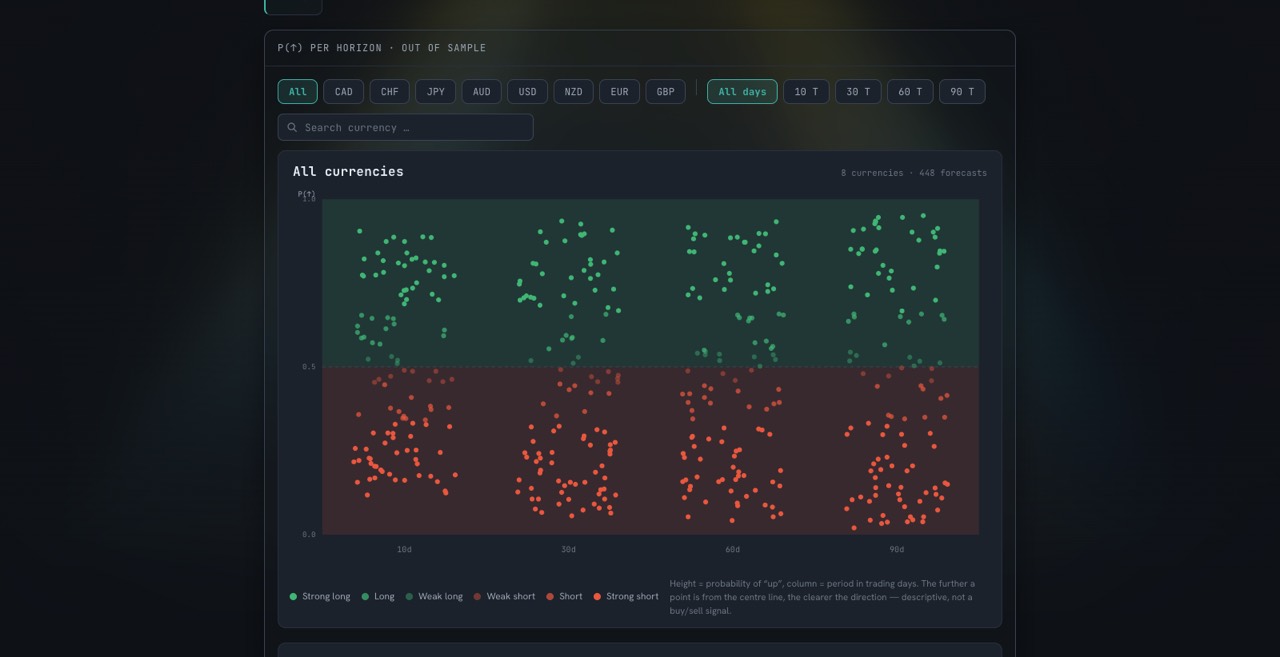
Drift forecast weighs more than 30 features per currency and states a direction as a probability, not a signal. In the ML lab every out-of-sample forecast is on record, edge & calibration shows the hit rate in the open.
Read the background in research09 · Strategy, testing & risk
From an idea in words to the risk of ruin — in Drift Starter too.
The indicator engine turns your strategy in your own words into a TradingView indicator (Pine v6) — no repainting, with more than 100 building blocks from price action to pivots. You can also paste your own Pine code and let the tool change it. The backtest engine tests seasonal, lead-lag, spread and combined, Monte Carlo reshuffles your trades thousands of times, and the prop-firm simulation shows a challenge’s pass rate up front.
Read the background in researchThe tool library
27 tools in 8 categories. Every one is included in the full terminal; the marked category in Drift Starter too.
01Overview1 tool
01.01
Dashboard
Every view as a widget with a window view; save and switch your own layouts.
All of it live in the terminal
Start your first trial for free — 3 days, every view open.
02Regime & risk2 tools
02.01
Risk regime
Score 0–33 from nine drivers (incl. VIX, credit spreads, the yield curve, the dollar), with history.
Reads · Inputs · history02.02
Volatility
Realised, implied and forecast volatility kept apart; quiet band and breakouts per market.
Reads · Realised · implied · forecast · regime03Macro & rates8 tools
03.01
Macro Data
470 indicators for eight currency areas with previous, forecast and next release; plus government bonds.
Reads · Indicators · yields03.02
Fundamental profile
Each currency on one page: rates, inflation, growth, strength.
03.03
Interest Rate & Carry Monitor
Policy rate differential, bond curves, implied expectations, theoretical forward and swap calculator per pair.
03.04
Macro Fair Value
Equilibrium rate per pair from price levels and fundamentals, with forecast and backtest.
03.05
Central Bank Intelligence
Each of the eight central banks in context: stance, dates, read.
03.06
Macro Surprise Tracker
Actual against consensus per release, surprise and direction, plus a score over 10, 30 and 60 days.
03.07
Macro Divergence Radar
Flags when a rate breaks away from rate differentials and positioning.
03.08
US Treasury
Yield curve, spreads, auctions and history of the US bond market.
04Positioning & strength3 tools
04.01
COT Index
CFTC positioning by trader group as an index from 0 to 100 against its own history (26 to 156 weeks).
Reads · Legacy · financial futures04.02
Currency strength
Momentum rank of all eight currencies, with home index.
04.03
Sector Performance
US sectors as sector ETFs against the broad market, next to the currencies.
All of it live in the terminal
Start your first trial for free — 3 days, every view open.
05Market structure3 tools
05.01
Correlation Matrix
Historical and option-implied correlation across currencies, commodities and yields.
05.02
Regression & Relative Value
How far a market strays from its partner, with scatter plot.
05.03
Seasonality
Up to 32 years, free range, weekdays and statistics per pattern.
All of it live in the terminal
Start your first trial for free — 3 days, every view open.
06Models3 tools
06.01
Drift (BETA)
Direction per currency as a probability with confidence; plus the historical price drift.
06.02
ML-Lab
Every out-of-sample forecast on record, per pair.
06.03
Edge & calibration
Hit rate and calibration in the open, misses included.
All of it live in the terminal
Start your first trial for free — 3 days, every view open.
07World & news2 tools
07.01
Global Event Map
Full-screen globe with satellite imagery, layers and values per country, plus the country score from 0 to 100.
07.02
News & sentiment
Headlines and calendar per currency.
08Strategy & riskalso in Drift Starter · 5 tools
08.01
Indicator engine
Your strategy in words or your own Pine code → TradingView indicator (Pine v6), no repainting, with backtest.
08.02
Backtest engine
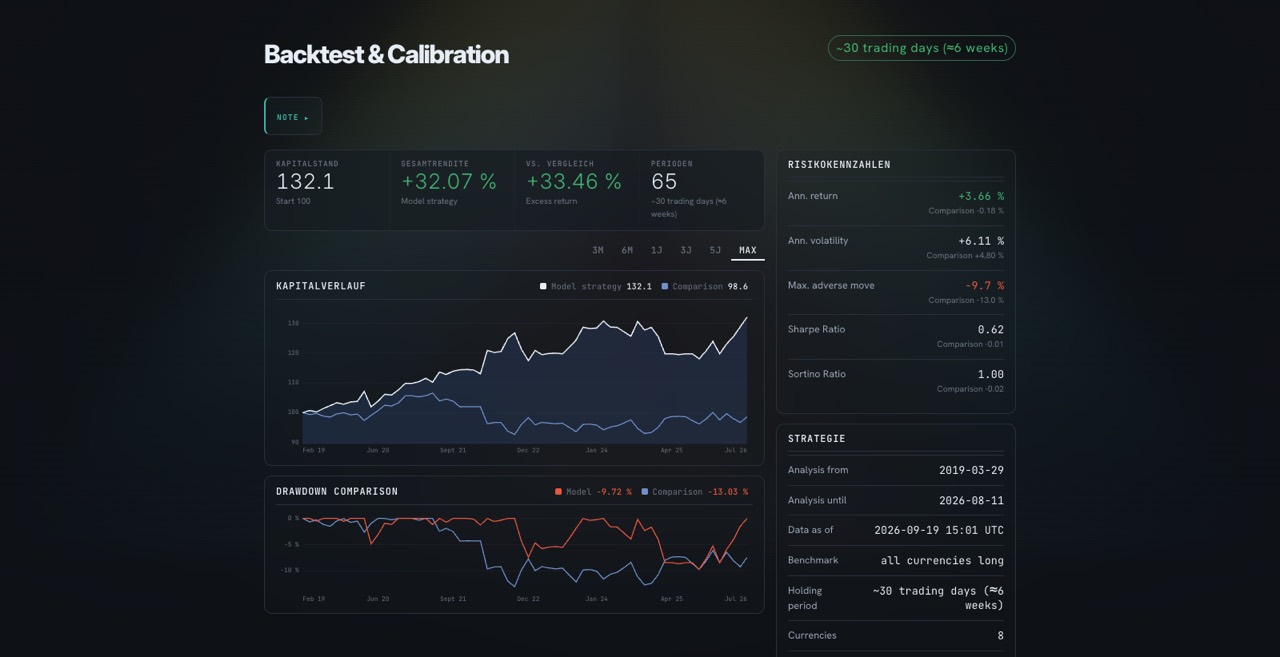
Seasonal (walk-forward), lead-lag, spread and combined, evaluated per year.
08.03
Monte Carlo
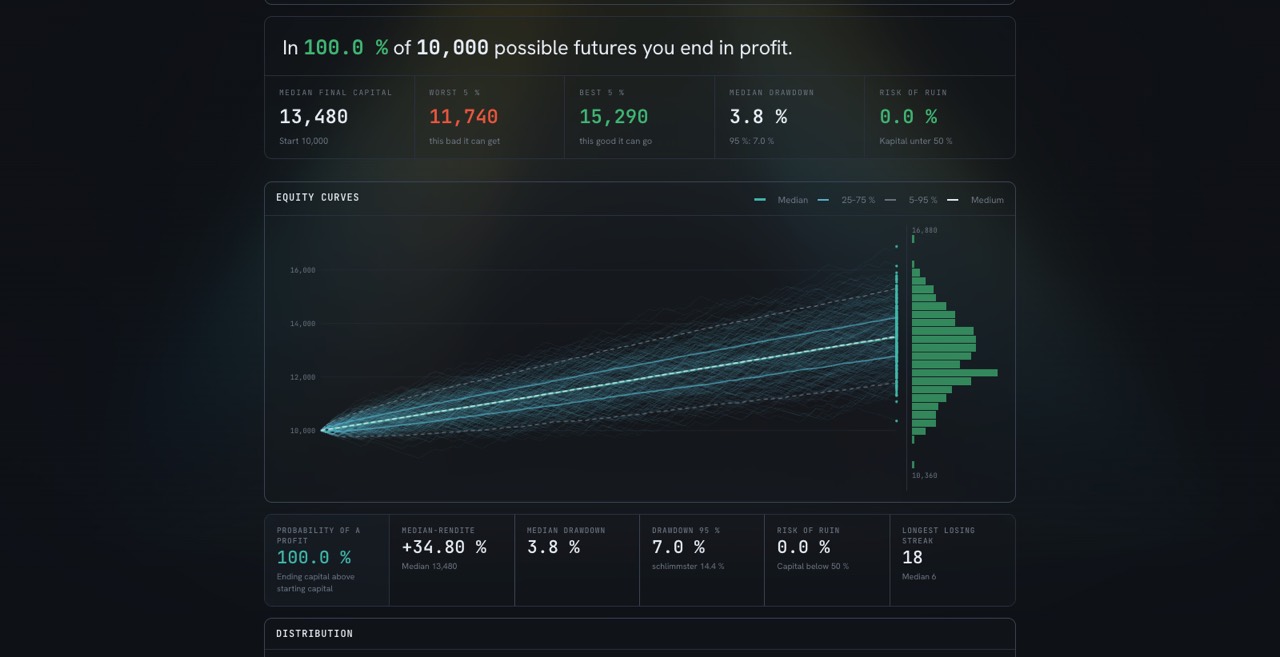
Your trades reshuffled thousands of times: spread, drawdown, risk of ruin.
08.04
Prop-firm simulation
Your own rules per phase, daily loss, max loss, consistency — pass rate up front.
08.05
Trading journal
Calendar, analysis by day, week and month, screenshot per trade, MT5 connection.
All of it live in the terminal
Start your first trial for free — 3 days, every view open.
Questions about features
Missing something? Write to us — many tools started as customer requests.
Ask us directlyEight currencies (USD, EUR, GBP, JPY, CHF, CAD, AUD, NZD) and their 28 pairs. Correlation, seasonality and backtest also use indices, commodities, yields and crypto.
No. The terminal describes the picture and states probabilities with an open test record. You make the decisions.
Every day all data runs through the pipeline. When you open the terminal, everything is already computed.
Indicator engine, backtest engine, Monte Carlo, prop-firm simulation and trading journal — for 5,00 € a year. Everything else is part of the full terminal.
No. Even the indicator engine understands your strategy in plain words and writes the Pine code for you.
In the browser, on desktop and phone. Nothing to install.
In short
Drift Engine puts the fundamental side of the currency market on one screen: risk regime, macro data, rates and carry, valuation, COT and strength, correlation and volatility, seasonality, models with an open test record and tools for your own strategies. Descriptive, not signals. Start for free with 3 trial days on your first full subscription.